Sunday, October 23, 2016

Creating Report Subscriptions

Small followup post to the report i released yesterday

The reason i released that particular report is that i saw a discussion somewhere (Reddit or the winadmins slack) on that people outside the Configmgr team never use reports or any other means of staying updated on how well the clients are managed.
I can understand that for a sysadmin/manager that don't work with Configmgr on a daily basis the wall of reports with vague names can be confusing and hard to use.

Half of the solution to this is creating custom reports that are easy to use and read, the other part of the solution is subscriptions. I don't expect that the users them self are going to find the relevant reports and setup subscriptions ,I create the subscription for them.

We have 18-19 sites that have their own local IT-staff ,they get the "Collection Summary" report for their site(Collection) by email every Monday. I also have  a few other reports that i send out on a regular basis.
Some of them are just lists of things that are broken. I call them "fix lists" that are so simple that anyone can start working on them ,they don't have to be an Configmgr expert and know where to find deployment errors in the console.
The report bellow is sent to the helpdesk team leader every Monday ,he then splits it into support cases for the team to take care of.

The picture is the actual list that will be sent out tomorrow. It used to be loooong ,but after we started doing this it has shrunk down to 8 machines.

In our experience 1603 errors needs to be fixed manually, but a lot of the other error codes sort them self out. That's why I only list 1603 errors. 
1603 Errors report.
The color squares are indicators for when the machine last was online. (start working on the green ones ,the red ones are of the network.)

Here is another example of a fix list that i send to the helpdesk. All computers that have a Windows Update that's in an error state.
 Lot if these reports are ugly ,I haven't bothered making them look good.


Windows Update Errors for a Collection. 

The reports i send to the helpdesk and other IT people tend to be error focused. This is stuff you need to fix!

I also have i few reports that i sent to managers, but they tend to emphasis on the good parts:-)
Like this one for application deployment success rate.

Application Deployment Successrate (Also does Software Update and Task sequences)


Saturday, October 22, 2016

Collection Summary Report ,3 in one Report! (Windows Update ,Endpoint Protection ,OS and Computer Model)

Finally got around to tweaking and translating my "Collection Summary" Report.

I created this report to replace several other reports that i force feed our site admins on a weekly basis:-)
The report is designed to be an e-mail report, sent out once a week that gives them a quick overview of whats going on at their site(collection).
This report have 3 sections ,Computer Details(OS,Model and Inactive Clients), Endpoint Protection and Windows Update.

I decided to focus on these 3 tings in the first version of this report. There are probably hundred of other things i could have put in the report that would have been useful ,but can't have everything in one report.
Collection Summary Report

Note! The Collection Parameter dropdown list only shows Endpoint Enabled Collections. This is because Endpoint summary data is only collected for Endpoint Collections.
(Right Click the Collection --> Properties -->Alerts Tab --View this Collection in the Endpoint Protection Dashboard)

The report is divided in 3 sections ,Computers ,Endpoint Protection and Windows Update.

Computers:

The OS and Model chart should be pretty self explanatory ,but on the boxes on the right is meant to give some information on how many of the clients are inactive.

Endpoint Protection

The two graphs show Antivirus pattern age and Engine version. 
The list in the middle give a quick count of malware detected in the collection the last 14 days.
The boxes on the right shows summarized endpoint data ,how many endpoint clients in collection ,how many inactive clients and how many clients that are "at risk".

You can click the plus sign in the At Risk box to show a list of clients and whats wrong with them.


Windows Update

Windows Update shows you Compliant vs Non-Compliant pie chart and a Last scan graph. while the boxes on the right shows deployment and scan errors.

The Deployment and Scan Error Boxes can be clicked to bring up a details list ,giving some info on the problem. 
There's a tool-tip on the error codes that tries to resolve the error code.


The query for the Compliant vs Non-Compliant might not be what you expect it to be ,it's tuned to show what the site admins should worry about.
If you look at the where statement bellow I'll explain the reasoning behind this query.
  • We only look at the status "need update" ,if a client haven't evaluated an update yet and don't know if it needs it or not(unknown state) we just assume it'll be OK.
  • We only look at updates with severity of "low" or higher ,unclassified updates don't count:-)
  • We only look at deployed updates. If I haven't deployed the update they don't need to worry about it.
  • We don't care about expired and superseded updates!
  • We don't count update newer that 14 days ,giving the us a "graceperiod" where the clients can install the update before they're considered non-compliant. 
WHERE a.status = 2 AND b.severity >= 2
AND b.daterevised < dateadd(day,-14,getdate()) 
AND b.isDeployed = 1 AND b.isExpired = 0 AND b.isSuperseded = 0

This can  be tweaked to match your SLA.
If you don't have an SLA just ask yourself this ,how long after you've deployed an update before you expect that all clients have it installed. if the answer is 30 days ,set the grace-period to 30 days:-)


The Grace-period and minimum Severity is easily changed in the report. The if you need to change the other things you have to edit the query. 
If you don't like the Grace-period concept,just set it to zero:-)


Monday, September 12, 2016

Windows 10 - Editions and Versions Report (in lack of a better name)


Hi

May 02: Quick Update ,seems to be a small "bug" with how Windows 10 1703 (Creators Update) registers in Configmgr DB. For some reason the "branch" field is a empty string, not 0 as expected (or at least NULL instead of empty string).
have created a new version of the report (Download it here) as a work around for this issue.


Created this report a few months ago, but didn't release it because I  wasn't sure my reverse engineering was correct until Windows 1607 was released.
But now Windows 10 1607 is released and everything seems to line up.

This report needs Configmgr 1602 to run (maybe it'll work on 1507 ,but haven't tested it)

The report is a details report for Windows 10 ,It can shed some light on Editions,Versions ,update rings and "state". As with most of my reports you can run it against a specific collection to limit the result and contrary to the console, it gives you a detailed list of witch computer is running what.

 & '.\Upload Reports v3.ps1' -webServiceUrl http://yourreportserver.fqdn

(Read more about the script and additional parameters here)

Added some parameters to the report to enable you to show ex. only computers on "Current Branch" or only computers that have reached "End of life".


If you found it useful ,feel free to spread the word:-)

Let me know what you think in the comments below or on Twitter. 


Friday, September 2, 2016

Distribution Point Reports ,Bonus Content

Got a question under the blogpost for my distribution point reports about a "Content View". Basicly a list of packages with colums for each Distribution point.

 When i created the Distribution Point Reports i actually had this type of view in the early versions  of the reports ,but I didn't include it in the final version.

So if someone else find it usefull ,here it is. I've cleaned up the report to make it look like the other ones.


Wednesday, June 29, 2016

v_GS_OPERATING_SYSTEM not updating correctly


I'm working on my Windows 10 Report ,but i've run into a strange problem and i'm wondering if anyone else sees the same thing.
The problem seems to be that v_GS_OPERATING_SYSTEM SQl view is not updating correctly. lots of machines that have been upgraded to Windows 10 still show their old Operating system.
v_r_System seems to be correct and i have verified that the machines are running windows 10


If anyone running Configmgr 1511 or 1602 could run this query and see if they have the same problem that would be great.
Reply here or on twitter.

SELECT A.name0,
       A.user_name0,
       A.client_version0,
       D.caption0,
       A.build01,
       A.osbranch01,
       B.NAME,
       B.state,
       C.value,
       C.localeid,
       D.installdate0,
       A.operating_system_name_and0
FROM   v_r_system A
       LEFT OUTER JOIN vsms_windowsservicingstates B
                    ON B.build = A.build01
                       AND B.branch = A.osbranch01
       LEFT OUTER JOIN vsms_windowsservicinglocalizednames C
                    ON B.NAME = C.NAME
       LEFT OUTER JOIN v_gs_operating_system D
                    ON A.resourceid = D.resourceid
WHERE  A.build01 LIKE '10.%' 


Add  And D.Caption0 not like '%10%' to the end of the query to only show entries with the wrong caption

Btw! here's a sneak peak of the Windows 10 Report I'm working on


Tuesday, June 28, 2016

How we use Configmgr OSD Prestage to deploy 2500 laptops with almost no network load

This post got a bit longer than intended ,jump to the bottom to read about how we use prestage task sequence to deploy 2500 laptops in a very short time period across 16 sites from one central Distribution Point with no network load and no interaction other than powering them on.

This may not be a good solution for  everyone ,but it works very well for us.
We're happy since we can make changes to the image at any time ,we're no longer screwed if we find a flaw in the image after the vendor have applied the image. takes the pressure off.
The vendor is happy ,the prestage image only takes 3 min 20 sec to apply from USB compared to some of the other customers image that take 1 hour pr machine. No bottlenecks in their factory line
The site admins are happy since they can deploy as fast as they like without worrying about the network link

I will post more details on how to set this up soon ,or even better I'll see if i can get my colleague to do the write up since he's the brains behind this.

I work for a Troms County Council in Norway and part of my job is to supply services to our 16 upper secondary school. Troms County has since 2006 bough laptops to all students when they start on the first year. The student use the laptop for the 2-3 years of school and after they are done they get to keep the laptop.
Each year we buy 2500+- new laptops intended for the new students that start in August. As soon as school starts the pressure is on to get the laptops distributed as fast as possible so that they can start using them.

Since 2006 we have had many different ways of deploying OS and applications to the laptops. some of them worked OK and some were complete disasters (remember this was 2006 ,before MDT and Configmgr). We've always had the computers branded, imaged and unboxed by the vendor, but the machines still needed to be named ,joined to the domain ,assigned to the student in the asset system and loaded with the correct software for their class on site.

2006 - 2007

First year the solution was a dual boot XP Home - XP Pro solution ,the idea was that they used the XP Pro for school work and XP Home for personal stuff. Add in some sketchy Boot Manager software that hid the XP Home partition when booted in XP pro and vice versa.
As you might have guessed that didn't work very well. The Dual boot software often corrupted one or both of the partitions causing lots of trouble.

2007 - 2009

We dropped the dual boot stuff after one year and went with the newly released Windows Vista.
...yeah, nuff said.
The only thing worth mentioning is that we got the requirement that the image should be made available to the student on a DVD, so we actually got 2500 dual layer DVD's printed.

2009 - 2014

Jump to Windows 7 and MDT and things start to get usable. but still required a lot of work when the machines arrived on site.

We got Configmgr 2007 around 2010 ,but it didn't change much. We stilled used "wds style" images for this process. they were created in mdt, but was basically fat images that got loaded on the machines.
Remember the machines are imaged 2 months before school begins so we don't know witch student get what laptop, how many for each class and so on. So the computers are loaded with a generic image.
That being said ,this solution probably lived a few more years that it should have, since this only happens once a year it was easier and faster to do the same procedure as the year before rather that come up with something better.


 2014 - Present


This is probably what you came here to read.
Now we use the prestaged-content feature of Configmgr 2012 to image the laptops. we've used this system for the last two years and we're now preparing for the 3rd round.

The big advantages of this system is:

  • No network load (all content is pre staged on the disk)
  • The task sequence is very fast 15 minutes from start to finish
  • The deployment is zero-touch (light touch if you count the power button)
  • Applying the prestage image takes only 3minutes 20 seconds pr machine so the vendor is very happy.
  • We can still make changes to the drivers and apps after the machines are pre staged. If we decide to update java ,will download only the new java package ,the rest is loaded from disk.

The system consist of 3 task sequences:


1st Task Sequence (Create Prestage)

The first task sequence is just a stripped down copy of the task sequence you want to use where you've removed all the unnecessary stuff that this model don't need. Like drivers for other models.
This task sequence is only used for deciding what content to prestage on the computers.

2nd Task Sequence (Deploy Prestage)

This is the one that we send to the vendor. it's the one that does all the work.
This task sequence partitions the disk ,loads the prestage image and boot image on the machines.
This task sequence have a lot of steps that run different scripts and commands to hadle all the disk stuff.


3rd Task Sequence (Deploy)

The third task sequence can be your normal task sequence, this is the task sequence the computers run once they come on site ,since everything is prestage it runs very fast. (15 minutes). We use thin images so the 15 minutes include installing Configmgr Client ,Office ,Flash ,Java and a dictionary application. 


So here is how it works.
  1. We create a prestage image that we send to our vendor.
  2. The vendor unpacks all the computers, add anti theft sticker ,image them and put them in backpacks.
  3. We get a asset file that we import into Configmgr. The machines are imported into a collection that have a required OSD advertised to it.
  4. Someone at the school plugs as many machines as they can handle into the network and starts powers them on. (Since there's no network load he can start as many wants)
  5. The machines boot and immediately start the OS Deployment.
    (boot image is slightly modified so that absolutely no keypresses are necessary) 
  6. The computers run the required task sequence in 15 minutes ,once they're finished they remove themselves from the prestage collection.
  7. The Asset system reads computers from a custom table in Configmgr  ,so they just have to assign the computer to the student's username.

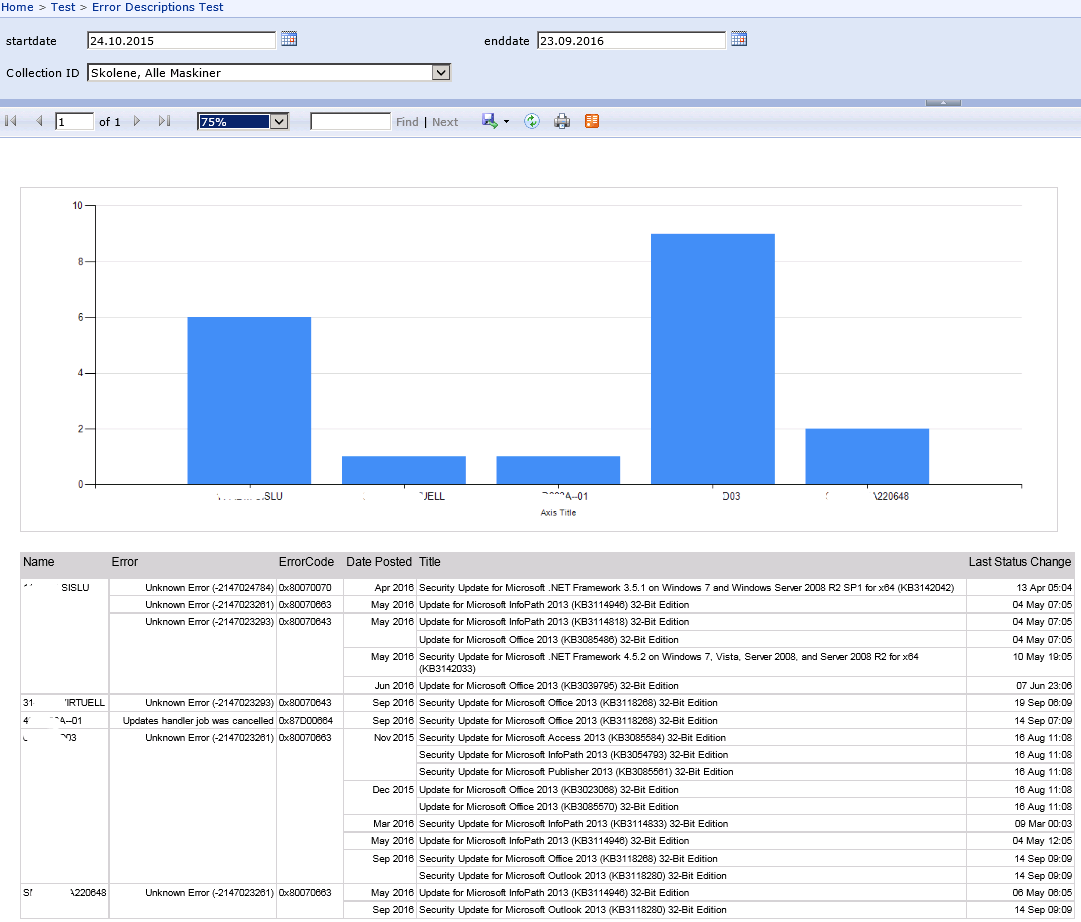
We use a custom version of my (old) OSD Overview report to monitor the deployment. 
Since we know it's supposed to take 15-16 minutes we have added a color rule to the databar that gradually changes from green to yellow the further away from 15 minutes it gets. Any errors are colored red so that they are easy to spot.


Next post will contain details on how to create the 3 task sequences.
If you can't wait read the guide we used here

Got any interesting imaging stories ,post them below? 

Tuesday, June 21, 2016

Distribution Point Dashboard Reports

 Latest version is 0.5
(to update just rerun the script with the "-overwrite $true" parameter)


June 27 - have made some small adjustments to the reports.
  • The color rule for the package error was wrong ,it's now fixed.
  • Added Package type to the details report. 
June 21 - Configmgr have skewed the dates by one day ,have corrected the dates in the query.


Had some trouble with content distribution to my distribution points last week. The patch Tuesday update package had failed to distribute to two of my DP's causing some clients to fail on installing patches.
The problem solved itself after some time,but it gave me an idea of a Distribution Point Dashboard, similar to my OSD Dashboard. The though is to have a single pane of glass to quickly give the information i need about my distribution points.

This is the result. as you can see I'm of the monochrome colour scheme for now, It's summer ,time for some more color!

Distribution Point Dashboard & Distribution Point Group Dashboard


Distribution Point Details


In the zip file you'll find a script to upload the reports and three reports in a sub folder. If you run the script with only the webservice parameter i'll upload the reports to ../Larsen Reports/Distribution Point/ folder and change the data source to your Configmgr Server


 & '.\Upload Reports v3.ps1' -webServiceUrl http://yourreportserver.fqdn

(Read more about the script and additional parameters here)

About the reports

DP and DP Group Report are almost the same ,the only difference is the controls. If you only have a few distribution points or you don't use distribution point groups ,go ahead an use this one.
If you have many distribution points the DP Group Report is a better choice, it allows you to first select a distribution point group and then select DP's from that group.


The Reports have a "Visual Limit" of about 10 DP's. The report will still work, but the graph might not be very readable with stats for 200 DP's on it:-)
The main part of the report is usage reporting for the DP's, but bellow that there a summary where i tried to show some useful info about the distribution points, like package status ,installed features and disk usage.


DP Details is as the name suggest for displaying details for a single distribution point. Displays a lot of the same information as the two others ,but it has details for all the packages on that DP. The Packages are sorted so that any problems are at the top.
It's linked up as a sub report for the two others ,but it can be run stand alone also.


Summary

Have had this report for two days and already it's paid of
  • Found out that a few of our DP's where running low on disk space  
  • One of our very remote Distribution Points had 6 packages that where "failed" and one forever "in-progress"
  • Our Endpoint Protection signature package was well overdue for a cleanup ,it contained 1732 files and was 2GB in size!!

If this report helped you spot and solve some problems/errors ,post bellow.

As always ,post questions and comments bellow and if you like this report feel free to spread the word on Twitter ,Facebook and so on:-)

Wednesday, June 15, 2016

Powershell Script - New Version of my SSRS Bulk Upload

This Powershell script takes all report files(.rdl) in a folder ,creates the folder structure on the server ,uploads the reports and changes the data sources.

If you liked the first version of this script ,you'll love the new version.
The first version was written to solve a problem and nothing more, but turned out that it was something the  SSRS community was waiting for as it is one of the most read posts on my blog.

The new version has been completely rewritten to make it more robust and in the process i've added a feature or two.
  • It now uses the Reporting Service 2010 Web Service
  • It's now structurally a better script. Easier to understand and work with.
  • Supports Folder structure
  • Can easily be modified to upload all kinds of elements like images,pdf+
The script is designed for Configmgr reports ,but the only part that's specific to Configmgr is the part that searches for the data source. To work with other data sources you just need to modify the search criteria or just "hard code" in the name of the shared data source you want to use.

How It works

The new script has default values on some of the parameters to make it easier to use.
only required parameter is the URL(-webserviceUrl) to the reporting server.

& '.\Upload Reports v3.ps1' -webServiceUrl http://yourSSRSserver

Default it will look in the script folder for reports ,upload them to a folder called "Larsen Reports" and wont overwrite if report already exist ,but all this can be changed by setting additional parameters.

  & '.\Upload Reports v3.ps1' -webServiceUrl http://yourSSRSserver -SourceDirectory d\Reports  -ReportFolder Demo -overwrite $true


In this example i just threw a few reports in a folder/sub folder structure. Some reports on the root and some in the sub directories.


I run the script assigning the -reportFolder paramenter to Demo.

As you can see in the screenshot under it first creates the folder structure, then it searches for *.rdl files and upload them to the correct folder/ sub folder and changes the data source.

This powershell script takes all report files(.rdl) ,creates the folder structure on the server ,uploads the reports and changes the datasources.

Everything should be ready to use!

Looking at the Report server, it has created the folders Demo and the 3 sub folders. The reports are uploaded in the right place.


..and the data source has been changed to the correct one.


Download: Upload Reports v3.zip

<#
.SYNOPSIS
    Bulk import SSRS Reports from a folder and update the reports data source.
.DESCRIPTION
    This script takes all the RDL files in a folder and imports them into a SSRS and updates the reports data source to the Configmgr shared data source.
.NOTES
    File Name  : Upload Reports.ps1
    Version    : 3.00 ,13.jun-2016
    Author     : Thomas Larsen - thomas.larsen@tromsfylke.no
    Requires   : Version 3
.LINK
    Blog
      http://larsenconfigmgr.blogspot.com

.PARAMETER webServiceUrl
Base URL to the report server ,usually the Configmgr Site server

.PARAMETER reportFolder
 Report Server folder where the reports are imported to, the script creates the folder if it's not there.
 
.PARAMETER SourceDirectory
The local folder where the .rdl files are located.

.PARAMETER Overwrite
Set to True if Script should overwrite Reports it they already exist.

.Example

& '.\Upload Reports.ps1' -webServiceUrl "http://Reportserver.domain.local"
Takes the report files from current directory(And Subdirectories) and uploads them the to a folder on SSRS called Larsen Reports(Default)

.Example

& '.\Upload Reports.ps1' -webServiceUrl "http://Reportserver.domain.local" -reportFolder "Larsen Reports -SourceDirectory "c:\ReportsToUpload" -overwrite $True
All Parameters ,select Sourcefolder Destination Folder ,Overwrite if exist


#>

Param(
   [string]$webServiceUrl,
      
   [string]$reportFolder = "Larsen Reports",

   [string]$SourceDirectory = $PSScriptRoot,

   [bool]$overwrite = $false
   )

Write-Host "Thomas Larsen - December 2015 - http://larsenconfigmgr.blogspot.com" -ForegroundColor Cyan
Write-Host "This Script is provided AS-IS, no warrenty is provided" 
Write-host ""

#Connect to SSRS
Write-Host "Reportserver: $webServiceUrl" -ForegroundColor DarkMagenta
Write-Host "Estabishing Proxy connection, connecting to : $webServiceUrl/ReportServer/ReportService2010.asmx?WSDL"
Write-Host ""

$ssrsProxy = New-WebServiceProxy -Uri $webServiceUrl'/ReportServer/ReportService2010.asmx?WSDL' -UseDefaultCredential

#######
#Get Configmgr shared datasource
$Items = $ssrsProxy.listchildren("/", $true) | where {$_.TypeName -eq "Datasource" }
foreach ($item in $items)
    {
    #Check to see if Datasource name patches Guid Pattern
    if ($item.name -match '{([a-zA-Z0-9]{8})-([a-zA-Z0-9]{4})-([a-zA-Z0-9]{4})-([a-zA-Z0-9]{4})-([a-zA-Z0-9]{12})}' -and $item.path -like '/ConfigMgr*')
        {
        Write-Host "Datasource:" $item.Name -ForegroundColor Magenta  
        Write-host "Type:" $item.TypeName 
        Write-Host "Path:" $item.Path

        #Save parameters for later use.
        $DatasourceName = $item.Name
        $DatasourcePath = $item.Path
        }
    }

function SSRSFolder ([string]$reportFolder,[string]$reportPath)
{
##########################################    
#Create Folder     
        try
        {
            $ssrsProxy.CreateFolder($reportFolder, $reportPath, $null) | out-null
            if($reportPath -eq '/')
            {
            Write-Host "Folder `"$reportpath$reportFolder`" Created"
            }
            else
            {
            Write-Host "Folder `"$reportpath/$reportFolder`" Created"
            }
        }
        catch [System.Web.Services.Protocols.SoapException]
        {
            if ($_.Exception.Detail.InnerText -match "rsItemAlreadyExists400")
            {
                Write-Host "Folder: $reportFolder already exists."
            }
            else
            {
                $msg = "Error creating folder: $reportFolder. Msg: '{0}'" -f $_.Exception.Detail.InnerText
                Write-Error $msg
            }
        }
}

Function SSRSItem ([string]$ItemType,$item,[string]$folder)
 {
 Write-host ""
 #ReportName
 if ($ItemType -ne "Resource")
 {
 $ItemName = [System.IO.Path]::GetFileNameWithoutExtension($item);
 }
 else
 {
 $ItemName = $item.Name
 }
 write-host $ItemName -ForegroundColor Green 

 #Upload File
     try
    {
        #Get Report content in bytes
        Write-Host "Getting file content of : $item"
        $byteArray = Get-Content $item.FullName -encoding byte
        $msg = "Size: {0} KB" -f "{0:N0}" -f ($byteArray.Length/1KB) 
        Write-Host $msg 
        
        Write-Host "Uploading to: $folder"
 
        #Sets property for images(only png)
        $type = $ssrsProxy.GetType().Namespace
        $datatype = ($type + '.Property')              
        $property =New-Object ($datatype);
        if ($ItemType -eq "Resource" -and $item -like "*.png")
        {
        $property.Name = "MimeType"
        $property.Value = image/png
        }
        else
        {
        $property = $null
        }

        #Call Proxy to upload report  
        $warnings =@();    
        $ssrsProxy.CreateCatalogItem($ItemType,$itemName,$folder,$overwrite,$byteArray,$property,[ref]$warnings) | out-null
        if($warnings.Length -le 1) { Write-Host "Upload Success." -ForegroundColor Green }
        else 
        {        
            foreach ($message in $warnings)
                {
                if ($message.Code -ne "rsDataSourceReferenceNotPublished")
                    {
                    write-host "$($message.Severity) $($message.Code) $($message.Message)" -ForegroundColor Yellow
                    }
                }
        }
    }
    catch [System.IO.IOException]
    {
        $msg = "Error while reading rdl file : '{0}', Message: '{1}'" -f $rdlFile, $_.Exception.Message
        Write-Error msg
    }
    catch [System.Web.Services.Protocols.SoapException]
 {
    $caught = $false
            if ($_.Exception.Detail.InnerText -match 'rsItemAlreadyExists400')
            {
                $caught = $true
                Write-Host "Report: $itemName already exists." -ForegroundColor Red
            }
            if ($_.Exception.Detail.InnerText -match 'CoretechSSRS')
            {
                $caught = $true
                Write-Host "Cant't find Reporting Extention File." -ForegroundColor Red
            }
            elseif ($caught -eq $false)
            {
                $msg = "Error uploading report: $reportName. Msg: '{0}'" -f $_.Exception.Detail.InnerText
                Write-Error $msg
            }
  
 }
}

Function SSRSDatasource ([string]$ReportPath,$DataSourceName,$DataSourcePath)
{
$report = $ssrsProxy.GetItemDataSources($ReportPath)
ForEach ($Source in $report)
    {
    $proxyNamespace = $Source.GetType().Namespace
        $constDatasource = New-Object ("$proxyNamespace.DataSource")
        $constDatasource.Name = $DataSourceName
        $constDatasource.Item = New-Object ("$proxyNamespace.DataSourceReference")
        $constDatasource.Item.Reference = $DataSourcePath

   $Source.item = $constDatasource.Item
    $ssrsProxy.SetItemDataSources($ReportPath, $Source)
    Write-Host "Changing datasource `"$($Source.Name)`" to $($Source.Item.Reference)"
    }
}

##Create Folder Structure
#Create Base Folder

Write-Host "Creating Folders Structure:" -ForegroundColor DarkMagenta
SSRSFolder $reportFolder "/"

ForEach($Folder in Get-ChildItem $SourceDirectory -Directory)
    {
    #Add each folder in the sourcefolder to the reporting service 
    SSRSFolder $Folder.Name /$reportFolder
    }

     
#Upload Reports in root folder
ForEach ($rdlfile in Get-ChildItem $SourceDirectory -Filter *.rdl )
{
SSRSItem Report $rdlfile /$reportFolder

#Change Report Datasource
$ReportPath = "/" + $reportFolder + "/" +  $rdlfile.BaseName 
SSRSDatasource $ReportPath $DataSourceName $DataSourcePath
}

##For Each folder
 
ForEach($Folder in Get-ChildItem $SourceDirectory -Directory)
    {
    #Add each folder in the sourcefolder to the reporting service 
    #SSRSFolder $Folder.Name /$Basefolder 
    
    #Add reports in the folder
    ForEach ($rdlfile in Get-ChildItem $Folder -Filter *.rdl )
        {
        SSRSItem Report $rdlfile /$reportFolder/$($folder.Name) 

        #Change Report Datasource
        $ReportPath = "/" + $reportFolder + "/" + $folder.Name + "/" + $rdlfile.BaseName 
        SSRSDatasource $ReportPath $DataSourceName $DataSourcePath
        }
    }

Tuesday, June 7, 2016

SSRS Report Speed Problem. How to increase the speed of your SSRS Reports.

Backstory

I tried to show my colleague one of my new reports, but when he tried to open the report it wouldn't load. He could enter the parameters just fine, but the report itself just hung at the "Loading" screen.
Tried the same on my computer and the same thing happened. When i ran the report on the server itself either from the browser or from Report Builder everything worked fine.
My first thought was that this was a speed issue so i started investigating. The problem in this case turned out to be a IE11 problem (setting the report site to comparability mode fixed that), but while I was investigating the issue I found something else that was very interesting.

The Problem

The issue is something called SQL Parameter sniffing and you can read more about it here, Essentially the problem is with the way SQL tries create a execution plan based on the size of the result, but when the query uses parameters the result may vary in size and the execution plan may be far from optimal.
There are several ways to get around this, the easiest way seems to be to add "optimize for unknown" to the query but that requires SQL 2008 R2 or above and may cause a problem for some. But i found a simple workaround while browsing stack exchange that seems to work just fine.

The Solution

The trick is to double up the parameters. Instead of using the @SSRS parameters directly you map the SSRS parameters to SQL Parameters and use the SQL parameters in the query.
I couldn't find a way to do this with multi-value parameters, but it looks like you only need to do this to some of the parameters to bypass the problem.

In the SQL snippit under i take the two SSRS parameters (@Timeperiod and @DefaultTimezone) and create two SQL parameters for them (@TimeperiodVar and @DefaultTimezoneVar) and tie them together. Then I replace the ssrs parameters with the new SQL parameters everywhere they're used in the query. 
DECLARE @TimeperiodVar DATETIME DECLARE @DefaultTimezoneVar INT
--set @AdvertisementIDVar = @AdvertisementID  SET @TimeperiodVar = @Timeperiod SET @DefaultTimezoneVar = @DefaultTimezone; 

The Result

Have a look at the Execution speed on the screenshot under(The Total time is in seconds and the rest is in milliseconds.).
The "OSD Dashboard" is the standard one and "OSD Dashboard Demo" has the new parameter system:


As you can see, I managed to cut the execution time for this report a lot!!
I managed to cut the SQL query time from between 22 seconds down to 0-5 seconds(yesterday it was 47+- seconds for the first one).
SSRS does some caching and so the results may vary, but around one second is what it takes when i run the query in SQL Management Studio.

So this little issue with IE11 Compability mode lead me down a path that enabled me to increase execution speed roughly 27x!

Have tested a few others reports and it seems very promising , I will defently use this on all my reports from now on.


Wednesday, June 1, 2016

OSD Details ,Part 2 of my OSD Dashboard Report

As promised, here is part 2 for my OS Deployment Dashboard.

It's designed to be a drill trough report from my OSD Dashboard,but you can also run it stand alone.
The query has been  completely rewritten from my last report so it should be a lot more reliable than the last version.


To upload the report ,download the zipfile and extract to a folder. you can upload the rdl files the old fashion way or you can test drive the new version on my upload script.

To run the script you only need to specify the url to the reporting server(normally the site server)
The script will create a new folder called "Larsen Reports"(can be set with parameter), upload the reports and change the datasource to your configmgr server. 

& '.\Upload Reports v3.ps1' -webServiceUrl http://your-report-server 


Staring with the controls ,the "Deployments" field lists all task sequences and deployments in a readable format. Next the "Computer" will filter to only show computers that have run that deployment.

Lastly for the "Start Date" and "End Date" you just need to make sure the computers OS Deployment are between these dates. (These two parameters are mostly used by the Dashboard to select the correct deployment when there are several attempts for a single machine.) 

The top of the report shows some basic info about the machine, name ,DN and hardware model if they are available.


The part your most likely interested in is the step by step status for the OS Deployment.
It'll show you a nicely formatted (if i may say so myself:-) ) list  with the details for each step. in the task sequence and how long time each step took.


The list is quite minimalist ,but a lot of info is available as tooltips. Execution status on the Group And Action Name and Exit Code and Action Output on the Step number.
If a group or action is skipped the text is over lined to illustrate that. If an action has an exit code other than 0 (Success) the line is colored red so any errors should be easy to spot.


If you have any trouble displaying the graphics in the report ,try restarting the SSRS Service.

As always, hope you like the report. Post comments and questions below.
If you think others might find this usefull ,feel free to share a link on twitter ,facebook and forums. (this blog is tiny so not many people have seen this yet) 


Friday, April 1, 2016

OS Deployment Dashboard


Update 7 June: 
Have updated the download link with an updatec version(much faster) of the report.
If you downloaded the report before 7 June 2016 you should update to the newest version.
New version is also include the drill trough report (OS-OSD Details Report) so that you can click on a Computer to bring up the step by step details for that OS Deployment.

One of the first reports that i posted on this blog and by far the most popular is my "OSD - Overview" report. That report is now over 2 years old ,since then I've done a lot of custom report work both internally and for other clients and I've learned a lot of new techniques. My old OSD report was no longer up to my standard so it was time to create a new one.

Been working on this for a couple of days now and i think it's ready to show the public ..,so i present to you ,the new "Task Sequence Dashboard" ,hope  you like it!

Task Sequence Report ,main page

Download

First page is a dashboard like view ,while page two and up contains details.
Hopefully most of the elements in the report should be self explanatory ,but i'll quicklime run trough some of the features.

The report has rebuilt controls ,now you can select only the task sequences that you're interested in. when you've selected the task sequences you get a list of deployments for the selected task sequences for, default it selects all deployments.
Last parameter is to set how far back you want to go ,default it's set to 3 months.


The main page have 4 elements:

Top left is a bar chart showing the number of OS Deployments pr day for the selected period.

Top right is an overview of what the success rate of each of the task sequences is in percent. It only considers "success vs. failed"

Bottom left is a overview of the active deployments for each task sequence. It shows the average runtime for each task sequence ,Active Deployements(that have been used) and how many computers have ran a each deployment.

Bottom right is a quick overview of what errors the computers might have encountered.
It has tooltips both on the table and the pie chart ,so if you hover over the error code it gives some more information.


Page two (and up) is a details page showing the status for each computer that have run the task sequence. It shows start and stop time using the clients local time ,and calculates how long the computer used on the deployment.
(Note! if the client hasn't done a hardware scan it uses a default timezone attribute in the report. Default it's set to 120)


I've colored coded the status messages so you can easily spot computers that have problems. The failed statuses have a tooltip that decode the error message when you hover over it.
(same decoder as the console uses ,it's not great for task sequence errors.)
Last column is bar chart so you easily can spot computers that used long time on the OSD.

Hope you like the report ,if you do please spread the word and/or post a comment bellow.


Wednesday, March 23, 2016

How-to add Date filters to a report

This is a quick post to answer a question i got in the comments of the "add collection selection" post.
The question was ,how to add start date and end date, start time and end time?

It's fairly easy to do ,all you need is a date field and the Between clause.
In this demo i'm going to use the client activity field as an example.

SELECT TOP 100 A.name0,
               A.user_name0,
               B.lastactivetime,
               B.lastddr,
               lasthw,
               lastsw
FROM   v_r_system A
       JOIN v_ch_clientsummary B
         ON A.resourceid = B.resourceid
WHERE  lastactivetime BETWEEN '2016-03-20' AND '2016-03-23' 


In SSRS you might want to use parameters as the date values ,in my example i create a "From" and "To" Parameters and set their default values ,making the report more user friendly

The From Parameters default value is set to "=DateAdd("d",-30,Today())" that sets the default to 30 days back.


The To Parameters default value is set to "=Today()" ,setting it's default to today.
Change the last line in the query to use the parameters

WHERE  lastactivetime BETWEEN @From AND @To 

when i run the report the two parameters should be set by default to display clients that have been active in the last month.


Hope you found this usefull.

Tuesday, March 22, 2016

ConfigMgr Client Versions.(Updated to support up to 1602)

Have updated this report to identify client up to 1602 ,you can either replace the whole report or just update the "clientinfo" query

Hi ,it's been a while since my last post so i thought i post a small report I created to check that my clients are running the latest version.
Don't know about you ,but i don't memorize version numbers ,so i created this report that maps the version numbers to different ConfigMgr releases ,CU's and Service packs.


Download: ConfigMgr Versions.RDL
(Have updated the report to identify clients up to 1602)


Unfortunately I haven't found a way to automatically map the version numbers so it's a manual
process. This relase can map versions up to "Configmgr 1602" ,but it's easy to add more versions numbers if you need to...


Hope you find this useful.
Feedback is always nice ,so if you like it, find a problem or have an idea for improving the report ,post a comment bellow.

As Always ,here is the query for the report:
(As you can see it's nothing to it ,just a big case statement that maps the version number to the version name)


SELECT A.name0,
       A.user_name0,
       B.lastactivetime,
       B.lasthw,
       B.lastsw,
       C.caption0,
       A.ad_site_name0,
       A.client0,
       A.client_type0,
       A.client_version0,
       CASE
         WHEN A.client_version0 = '5.00.7711.0000' THEN
         'Configuration Manager RTM'
         WHEN A.client_version0 = '5.00.7711.0200' THEN
         'Configuration Manager CU1'
         WHEN A.client_version0 = '5.00.7711.0301' THEN
         'Configuration Manager CU2'
         WHEN A.client_version0 = '5.00.7804.1000' THEN
         'Configuration Manager SP1'
         WHEN A.client_version0 = '5.00.7804.1202' THEN
         'Configuration Manager SP1 CU1'
         WHEN A.client_version0 = '5.00.7804.1300' THEN
         'Configuration Manager SP1 CU2'
         WHEN A.client_version0 = '5.00.7804.1400' THEN
         'Configuration Manager SP1 CU3'
         WHEN A.client_version0 = '5.00.7804.1500' THEN
         'Configuration Manager SP1 CU4'
         WHEN A.client_version0 = '5.00.7804.1600' THEN
         'Configuration Manager SP1 CU5'
         WHEN A.client_version0 = '5.00.7958.1000' THEN
         'Configuration Manager R2'
         WHEN A.client_version0 = '5.00.7958.1101' THEN
         'Configuration Manager R2 Hotfix: KB 2905002'
         WHEN A.client_version0 = '5.00.7958.1203' THEN
         'Configuration Manager R2 CU1'
         WHEN A.client_version0 = '5.00.7958.1303' THEN
         'Configuration Manager R2 CU2'
         WHEN A.client_version0 = '5.00.7958.1401' THEN
         'Configuration Manager R2 CU3'
         WHEN A.client_version0 = '5.00.7958.1501' THEN
         'Configuration Manager R2 CU4'
         WHEN A.client_version0 = '5.00.7958.1604' THEN
         'Configuration Manager R2 CU5'
         WHEN A.client_version0 = '5.00.8239.1000' THEN
         'Configuration Manager R2 SP1'
         WHEN A.client_version0 = '5.00.8239.1203' THEN
         'Configuration Manager R2 SP1 CU1'
         WHEN A.client_version0 = '5.00.8239.1301' THEN
         'Configuration Manager R2 SP1 CU2'
         WHEN A.client_version0 = '5.00.8239.1403' THEN
         'Configuration Manager R2 SP1 CU3'
         WHEN A.client_version0 = '5.00.8325.1000' THEN
         'Configuration Manager 1511'
         WHEN A.client_version0 = '5.00.8355.1000' THEN
         'Configuration Manager 1602'
         ELSE 'Unknown'
       END AS Clientversion,
       A.creation_date0,
       A.deviceowner0,
       A.distinguished_name0,
       A.full_domain_name0,
       A.internetenabled0,
       A.is_assigned_to_user0
FROM   v_r_system A
       LEFT OUTER JOIN v_ch_clientsummary B
                    ON A.resourceid = B.resourceid
       LEFT OUTER JOIN v_gs_operating_system C
                    ON A.resourceid = C.resourceid
WHERE  client_type0 = 1
       AND A.resourceid IN (SELECT resourceid
                            FROM   dbo.v_fullcollectionmembership
                            WHERE  dbo.v_fullcollectionmembership.collectionid
                                   IN ( @Collections ))