Update: I've created a new and improved version of this report. you can find it here:
OSD Dashboard
Do you have full control over all OS Deployments in your organisation? Do you know how long each machine took to complete the task sequence? Do you know how many OS Deployments are running right now?
If other people is running your task sequences you probably heard stuff like "Task Sequences are so slow","Ghost/WDS was much faster" and "The task sequence never works".
So to keep on top of things I created this report:

OSD-Overview.rdl
Update: I accidentally uploaded an older version with some Odd filters for the barchart.
I've updated the link to point to the new version.
Update: I accidentally uploaded an older version with some Odd filters for the barchart.
I've updated the link to point to the new version.
This report allows me to keep track of witch computer ran what task sequence and how long it took.
It also shows how many times each task sequence has been run the last 3 months and how many times they have failed.
I uses colored databars to visualize how long each machine took to complete the task sequence. It's not exact science since some task sequence takes longer than others to complete and some locations have faster connections then others ,but i know it should not take much longer than 50 minutes to complete a task sequence.
The report is based of a query i found on myITForum written by Jeremy Young.
I've modified the query a bit to show clients that haven't registered fully with Configmgr yet. I've replaced the joins with left outer joins ,and added some stuff to show running clients and clients that have timed out.
The report gives you a quick overview of OS Deployments running in your environment It show witch computer ran what task sequence at what time and how long it took.
It uses a bar graph in each column to indicate the run time ,allowing you to easily spot problems.
The bar is green if the task sequence completed in under 50 minutes ,over 50 minutes the bar becomes more and more yellow. This value is controlled by a parameter so you can easily change it to suit your environment.
The Bar graph at the top shows which task sequence have been ran in the last 90 days.
There's also a sub report for this so you can click on a computer to get the run time for each step ,so you know what took so long.
I will add this in my next blog post....

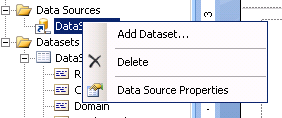
To get this report up and running in your environment you just need to download the .RDL file and import it into your environment. Then you need to edit it in Report Builder and change the "Datasource1" to point to your Configmgr SQL.
 |

The barchart at the top have a category group filter to filter out task sequences you don't want to include in the report. Default it don't include task sequences with "LAB" in the name.
To change the filter click the bar chart to get the chart data window. then right click the [PackageName] and select Properties.
Navigate to Filters and remove or edit the filter.
(Add the same filter to the Tablix if you don't want to see them at all)

Query:
/* Configuration Manager Task Sequence Execution Times
Original Query By: Jeremy Young (jeremy.young@microsoft.com)
http://myitforum.com/cs2/blogs/jeremyyoung/
Modified with looser joins and some other stuff to allow for clients that havent registeret with confimgr yet.
*/
DECLARE @DefaultTimezone INTEGER
SET @DefaultTimezone = 120
--build a CTE with the TS execution details
;
WITH tsx (computername, packagename, advertisment, executiontime, step, exitcode
,
position, executionstatus, executionid)
AS (SELECT cm.name0 AS ComputerName,
pkg.NAME AS PackageName,
ad.advertisementid AS Advertisment
--execution time has been converted to GMT; use offset to convert it to machine local time
,
CASE
WHEN ws.timezoneoffset IS NULL THEN
Dateadd(minute, @DefaultTimezone, ts.executiontime)
ELSE Dateadd(minute, ws.timezoneoffset, ts.executiontime)
END AS ExecutionTime,
ts.step,
ts.exitcode
--determine if it was a start or end
,
CASE
WHEN ( ts.laststatusmessageidname =
'The task sequence execution engine started execution of a task sequence'
AND step = 0 ) THEN 'Start'
ELSE 'End'
END AS Position
--consolidate the other TS messages into short status messages
,
CASE
WHEN ts.laststatusmessageidname =
'The task sequence execution engine aborted execution for a failure of an action'
THEN 'Aborted'
WHEN ts.laststatusmessageidname =
'The task sequence execution engine successfully completed a task sequence' THEN
'Completed'
WHEN ts.laststatusmessageidname =
'The task sequence execution engine failed execution of a task sequence'
THEN 'Failed'
WHEN ts.laststatusmessageidname =
'The task sequence execution engine performed a system reboot initiated by an action'
THEN 'Timed Out'
ELSE 'Unknown'
END AS ExecutionStatus
--partition the data into task sequence start times per package name
,
Dense_rank()
OVER (
partition BY name0, pkg.NAME
--only get starts at step 0 versus when the task sequence restarts after a reboot for example
, CASE WHEN (ts.laststatusmessageidname =
'The task sequence execution engine started execution of a task sequence' AND
step=0) THEN 1 ELSE 0 END
ORDER BY ts.executiontime DESC) AS ExecutionID
FROM
--systems
(SELECT name0,
resourceid
FROM v_r_system) cm
--timezone data
LEFT OUTER JOIN (SELECT resourceid,
timezoneoffset
FROM v_gs_workstation_status) ws
ON ws.resourceid = cm.resourceid
--task sequence execution data
JOIN (SELECT resourceid,
advertisementid,
step,
exitcode,
laststatusmessageidname,
executiontime
FROM v_taskexecutionstatus ts
WHERE
--get TS starts or Ends of a task sequence execution
(
--Ends
laststatusmessageidname IN (
'The task sequence execution engine successfully completed a task sequence',
'The task sequence execution engine aborted execution for a failure of an action'
,
'The task sequence execution engine failed execution of a task sequence' )
OR
--Starts
( laststatusmessageidname =
'The task sequence execution engine started execution of a task sequence'
AND step = 0 )
OR
--Timeouts
( laststatusmessageidname =
'The task sequence execution engine performed a system reboot initiated by an action'
AND ts.executiontime < Dateadd(day, -1, Getdate()) ) )) AS ts
ON ts.resourceid = cm.resourceid
--advertisement info
JOIN (SELECT advertisementid,
packageid
FROM v_advertisement) AS ad
ON ad.advertisementid = ts.advertisementid
--package info
JOIN (SELECT packageid,
NAME
FROM v_package) AS pkg
ON pkg.packageid = ad.packageid)
--select out a consolidated row
SELECT tsStart.computername,
tsStart.packagename,
tsStart.executionid,
tsStart.advertisment,
tsStart.executiontime AS
StartTime,
tsStart.step AS
StartStep,
tsEnd.executiontime AS
EndTime,
tsEnd.step AS
EndStep,
tsEnd.executionstatus AS
ExecutionStatus,
CONVERT(VARCHAR(8), tsEnd.executiontime - tsStart.executiontime, 108) AS
ExecutionDuration,
Datediff(day, tsStart.executiontime, Getdate()) AS
ExecutedDaysAgo
FROM (SELECT *
FROM tsx
WHERE position = 'Start') AS tsStart
LEFT OUTER JOIN (SELECT *
FROM tsx
WHERE position = 'End') AS tsEnd
ON tsStart.computername = tsEnd.computername
AND tsStart.packagename = tsEnd.packagename
AND tsStart.executionid = tsEnd.executionid
ORDER BY starttime DESC
Hi Thomas
ReplyDeleteGreat post, thanks. However, I've tried this in my environment and I'm getting a blank report. Si, I went into SQL and ran a 'select * from v_TaskExecutionStatus' and got 0 rows returned. Is there some component I need to activate to start populating this table/view?
Thanks
Con
No ,should work on a standard installation.
Deletev_taskExecutionstatus should contain execution status for each step in the task sequence for every computer that have been deployed.
Just testet on my configmgr SQL , "select * from v_taskexecutionstatus" should work.
In addition to changing the data source, I had to edit the dataset properties. They started with: use CM_VGS.
DeleteThat got the bottom section working. However, the top section still says 'No Data Available' for me. Any ideas?
I definitely like the report otherwise!
The "Use" statement is ignored by SSRS ,you can remove it if you want. It just a leftover from building the query in SQL Managment Studio.
DeleteI've checked the report and i have uploaded a version with a filter for the bar chart. To remove it click the diagram so you get the control window on the right.
Right click the [Package Name] under category group and select Properties.
Go to filter and remove or modify the filter.
I'll update the download link with the new version tomorrow.
Excellent!
DeleteI'd love to have the top bar chart working. I'm just not sure what is causing it to report "No Data Available". Are there any settings or configurations that I need to add or edit to get to populate data? Or should it be working by default?
Scratch that last question. Maybe I should test before I post. The latest version of the file works perfectly. Thanks!
DeleteI've updated the download link and added a section about filters in the post.
DeleteIf you get "No Data Available" make sure you have removed(or edited) the filter for the barchart.
The filter is on the Category Group ,right click the [PackageName] under Categorygroup in the Chart data window and select Properties.
Navigate to Filters and remove the filter.
Hope you get it working.
Brilliant! Thank you for sharing this - Now we're just waiting for the sub report... :)
ReplyDeletePosted about an hour ago:-)
Deletehttp://larsenconfigmgr.blogspot.no/2014/10/Keep-track-OS-Deployments-Part-2.html
Hi Thomas - I have been using your report for quite som time, really great report.
ReplyDeleteHowever i would like to hear you if it's easy to add a counter of total occurences of reinstallations.
It could be used to do a bit of trending towards machine types.
If a particular machine type has been reinstalled many times, there could be a problem with that particular model.
Hi glad you like it ,got a few ideas for a version 2.0 of this report ,so when i get the time I'll add a few more features to the report.
DeleteIt's not clear to me what you're looking for ,is it a chart/table that shows computers that have ran a task sequence multiple times within the time period ,or something else?
A table i think is sufficient.
ReplyDeleteWhat i would use it for is some trending analysis on my environment - so i could find out if a machine is reinstalled often and if it is, it might be a problematic machine, and it might not help to reinstall it all the time :)
A timespan would be nice to have, but it's not a need to have.
I hope it made sense - otherwise i'll gladly try to clerify.
I've been trying leverage the ResourceID from this query, so that I can use it with the subreport to monitor 'unknown' machines during a build. With the subreport, selecting the 'unknown' machine returns every unknown machine and their progress in the same report. If we could use the Resource ID as the identifier instead of computername, we can report on the exact device. Unfortunately my SQL skills are not good enough to pull the ResourceID from this query. Any ideas how I can do this?
ReplyDeleteThanks
Con
I have got the report working in my environment, but I don't believe it's accurate. I created a collection in SCCM that polls all systems that have been imaged (joined in SCCM) in the last 72 hours and it accurately shows each machine that got imaged, but alot of the machines from the collection are not in the report. Is there something wrong with the report? How can I get all the systems to show in the report? (PS> I could send you my query for the collection if you would like to see how I'm retrieving that information)
ReplyDeleteI have got the report working in my environment, but I don't believe it's accurate. I created a collection in SCCM that polls all systems that have been imaged (joined in SCCM) in the last 72 hours and it accurately shows each machine that got imaged, but alot of the machines from the collection are not in the report. Is there something wrong with the report? How can I get all the systems to show in the report? (PS> I could send you my query for the collection if you would like to see how I'm retrieving that information)
ReplyDeleteThis seems to work great, but it is very slow. In my environment, it runs in 32 seconds consistently. A simple change is to dump the data from the where clause into a temp table. Then join the temp table to itself (which is where the slowness occurs). That simple change makes the query run in less than a second in my environment. Plus, that puts a lower cost on you SCCM server.
ReplyDeleteVery interesting...Faster is always better:-)
DeleteIs it the query that runs in 32 seconds or is it the whole report?
In my tests the query runs reasonably fast (2 seconds for a few hundred rows.) What takes a long time is the rendering of the report.
If you have a query that's faster ,shoot me a mail and I'll check it out.(you'll find the mail address at the about me page.).